
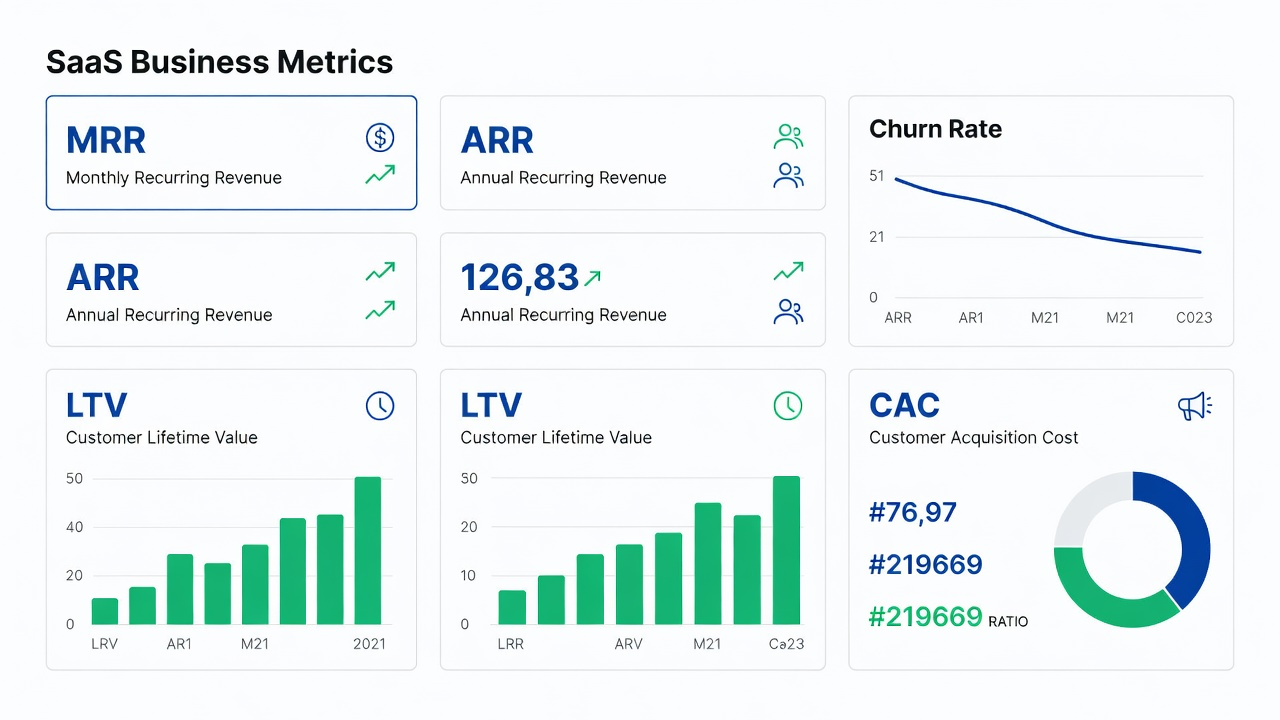
SaaS Metrics Every Founder Should Track (With Free Calculators)
Picture this: Your SaaS startup hits 10,000 users. Revenue streams in. Founders pop champagne. Then reality bites. Churn spikes. Cash burn accelerates. Growth stalls. Without clear metrics, that dream unravels fast.
SaaS metrics matter because they cut through the noise. They reveal if your subscription business thrives or merely survives. Track MRR, ARR, churn, LTV, CAC, and more to spot trends early. Founders who master these numbers make sharp decisions. They scale efficiently. They attract investors with hard data.
Enter Smart Sellers Tool, built for seller decisions. Our platform now offers 154 calculators, including a full SaaS stack. Instant transparent math for recurring revenue calculator needs. Use our SaaS metrics calculators to plug in your numbers. Get methodology & formulas that deliver clear numbers before they commit.
In this guide, we break down the eight essential SaaS KPIs. Learn what each means. See formulas. Understand benchmarks. Link straight to free tools. By the end, you will track like a pro.
1. Monthly Recurring Revenue (MRR)
MRR stands for Monthly Recurring Revenue. It totals all predictable revenue from active subscriptions in a month. Ignore one-offs. Focus on renewals and steady plans. This metric anchors your financial health.
Founders use MRR to forecast cash flow. It smooths seasonal dips. Track it weekly to catch issues fast.
MRR = Σ (Number of customers in each plan × Monthly price for that plan)

Example: 50 users at $50/mo + 30 at $100/mo = $5,500 MRR
MRR matters because it drives valuation. Investors peg SaaS companies at multiples of ARR, rooted in MRR. Low MRR signals weak demand. Rising MRR proves product-market fit. Pair it with growth rates for full picture. Check our SaaS growth metrics guide for deeper ties.
Benchmark: Aim for 15-25% month-over-month growth as good. Great hits 40%+. Below 5% raises flags.
Calculate yours now: MRR Calculator. Built for seller decisions with instant transparent math.
2. Annual Recurring Revenue (ARR)
ARR captures your yearly recurring revenue. Multiply MRR by 12 for a snapshot. It standardizes multi-year contracts into annual terms. Investors love it for quick comparisons.
Unlike MRR, ARR scales for enterprise deals. It ignores ramps or discounts in projections.
ARR = MRR × 12

Example: $10,000 MRR × 12 = $120,000 ARR
Why track ARR? It benchmarks against peers. VCs value at 5-10x ARR for hot SaaS. Stagnant ARR means trouble ahead. Growing ARR unlocks funding rounds. Link it to NRR for retention insights.
Benchmark: Good growth: 100-200% YoY. Great: 300%+. Under 50% YoY is a red flag.
Try the ARR Calculator for clear numbers before they commit.
3. Churn Rate
Churn rate measures customers or revenue lost monthly. Customer churn counts logos gone. Revenue churn weights higher-value losses. Both erode your base.
Calculate monthly for startups. Annual for mature firms. High churn kills growth despite new signups.
Monthly Customer Churn = (Customers lost ÷ Starting customers) × 100
Monthly Revenue Churn = (MRR lost ÷ Starting MRR) × 100

Example: 5 lost from 200 = 2.5% churn
Churn matters most. It dictates LTV. Fix it through onboarding, support. Low churn compounds revenue. Track cohorts to pinpoint causes like poor fit.
Benchmark: Good: 3-5% monthly. Great: under 2%. Over 8% signals crisis.
Churn Rate Calculator delivers methodology & formulas instantly.
4. Customer Lifetime Value (LTV)
LTV estimates total revenue from one customer over time. Factor average revenue per user against churn. Adjust for margins to get profit view.
It predicts long-term value. High LTV justifies spend on acquisition.
LTV = (ARPU × Gross Margin) ÷ Monthly Churn Rate

ARPU = MRR ÷ Total customers
Example: $100 ARPU, 80% margin, 4% churn = $2,000 LTV
LTV guides budgets. Compare to CAC for sustainability. Rising LTV shows pricing power or retention wins. Founders ignore it at peril, burning cash on low-value users.
Benchmark: Good: 2-3x CAC. Great: 5x+. Under 1.5x CAC warns of losses.
Compute with our Customer Lifetime Value Calculator.
5. Customer Acquisition Cost (CAC)
CAC sums all sales and marketing costs divided by new customers. Include ads, salaries, tools. Track by channel for efficiency.
It reveals acquisition effectiveness. Rising CAC squeezes margins.
CAC = Total Sales & Marketing Spend ÷ New Customers Acquired

Example: $50,000 spend for 100 customers = $500 CAC
CAC matters for scalability. Optimize channels. Low CAC fuels growth. Blend with LTV for ratio health. See our acquisition strategies post.
Benchmark: Good: $300-500. Great: under $300. Over $800 demands review.
CAC Calculator ready for your data.
6. LTV:CAC Ratio
LTV:CAC ratio divides lifetime value by acquisition cost. It tests if customers pay back spend threefold or more. Healthy ratios ensure profitability.
Aim higher as you scale. Early stage tolerates lower.
LTV:CAC = LTV ÷ CAC

Example: $3,000 LTV ÷ $1,000 CAC = 3:1
This ratio decides survival. Below 3:1? Cut costs or boost LTV. Great ratios attract capital. Track over time for trends.
Benchmark: Good: 3:1. Great: 5:1+. Under 2:1 is red flag.
Test yours: LTV:CAC Ratio Calculator.
7. CAC Payback Period
CAC Payback Period shows months to recover acquisition cost. Divide CAC by monthly gross profit from new customers. Shorter means faster cash recovery.
It measures capital efficiency. Long paybacks strain runway.
CAC Payback = CAC ÷ (ARPU × Gross Margin)

Example: $500 CAC ÷ ($100 ARPU × 0.8) = 6.25 months
Payback guides fundraising. Under 12 months? Solid. Link to LTV for full cycle. Founders shorten it via pricing or efficiency.
Benchmark: Good: 10-12 months. Great: under 9. Over 18 months risks burnout.
8. Net Revenue Retention (NRR)
NRR tracks revenue from a cohort after 12 months, net of churn but plus expansions. It exceeds 100% with upsells. Key for post-churn world.
Replaces gross retention in expansion-heavy SaaS.
NRR = (Starting MRR + Expansion - Churn - Contraction) ÷ Starting MRR × 100

Example: $100k start + $20k exp - $10k churn = 110% NRR
NRR proves sticky product. High NRR cuts CAC reliance. Benchmark against ARR growth. Essential for B2B scaleups.
Benchmark: Good: 105-110%. Great: 120%+. Below 100% erodes base.
Net Revenue Retention Calculator.
SaaS Metrics Benchmark Table: Good vs Great
Compare your SaaS KPIs to industry standards. Use this table for SaaS benchmarks. Red flags demand action.
| Metric | Good | Great | Red Flag |
|---|---|---|---|
| MRR Growth (MoM) | 15-25% | >40% | <5% |
| ARR Growth (YoY) | 100-200% | >300% | <50% |
| Churn Rate (Monthly) | 3-5% | <2% | >8% |
| LTV | 2-3x CAC | >5x CAC | <1.5x CAC |
| CAC | $300-500 | <$300 | >$800 |
| LTV:CAC Ratio | 3:1 | >5:1 | <2:1 |
| CAC Payback (Months) | 10-12 | <9 | >18 |
| NRR | 105-110% | >120% | <100% |
How These Metrics Connect: The System View
SaaS metrics form a loop. Not silos. Churn directly feeds LTV. High 5% churn halves LTV from $2,000 to $1,000 at $100 ARPU. Drop to 2.5%? LTV climbs to $2,000. Retention multiplies value.
CAC and payback tie to LTV:CAC. Spend $500 CAC with 80% margin ARPU of $100. Payback hits 6.25 months. LTV at $2,000 yields 4:1 ratio. Solid. Double CAC to $1,000? Ratio falls to 2:1. Redesign acquisition.
MRR and ARR grow via NRR loop. Start $100k MRR cohort. 110% NRR adds $10k net. Next year, compound. Churn drags, expansions lift. Example: 3% churn, 8% expansion = 105% NRR. Stack quarters: MRR doubles in 18 months.
Full system: Low churn boosts LTV. Strong LTV:CAC frees CAC spend. Short payback extends runway. High NRR accelerates MRR/ARR. Track weekly. Adjust quarterly. recurring revenue calculator tools make it simple.
Stop Guessing, Start Calculating
SaaS founders track these metrics or fade. Smart Sellers Tool equips you with 154 free calculators. SaaS metrics calculator suite covers MRR ARR churn LTV CAC and beyond. Methodology & formulas transparent. No black boxes.
Input data. Output insights. Built for seller decisions. Get clear numbers before they commit. Explore the full SaaS KPIs collection.
Join thousands scaling subscriptions. Start with one calculator today. Watch your business clarify.